Risk-First Analysis Framework
Start Here
Home
Contributing
Quick Summary
A Simple Scenario
The Risk Landscape
Discuss
Please star this project in GitHub to be invited to join the Risk First Organisation.
Publications

Click Here For Details
Map And Territory Risk
As we discussed in the Communication Risk section, our understanding of the world is informed by the names we give things and the abstractions we create.
In the same way, Risk-First is about naming risks within software development and calling them out.
Our Internal Models of the world based on these abstractions, and their relationships.
So there is a translation going on here: observations about the arrangement of atoms in the world get turned into patterns of information (measured in bits and bytes).
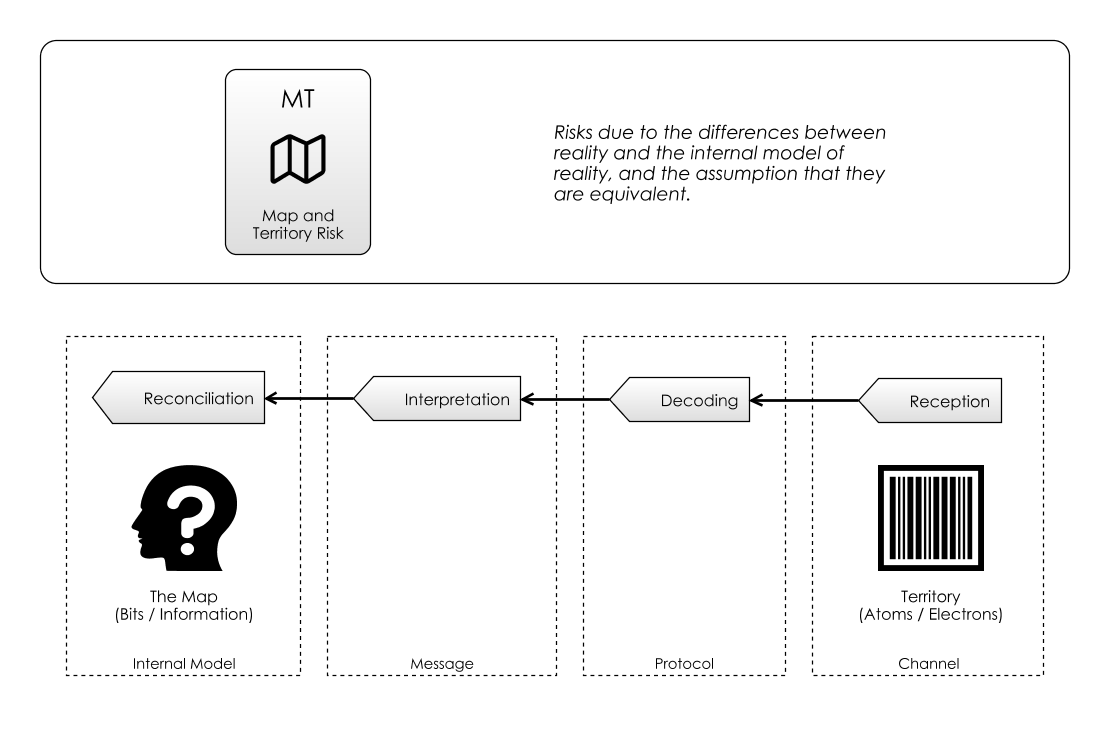
Like Trust & Belief Risk and Learning Curve Risk, Map And Territory Risk is an Internal Model Risk, and is the risk we face because we base our behaviour on our Internal Models rather than reality itself. It comes from the expression “Confusing the Map for the Territory”, attributed to Alfred Korzybski:
“Polish-American scientist and philosopher Alfred Korzybski remarked that “the map is not the territory” and that “the word is not the thing”, encapsulating his view that an abstraction derived from something, or a reaction to it, is not the thing itself. Korzybski held that many people do confuse maps with territories, that is, confuse models of reality with reality itself.” - Map-Territory Relation, Wikipedia
In this section, we’re going to make a case for analysing Map and Territory Risk along the same axes we introduced for Feature Risk, that is Fitness, Audience and Evolution. After that, we are going to widen the scope by looking at Map and Territory Risk within the context of machines, people, hierarchies and markets.
Fitness
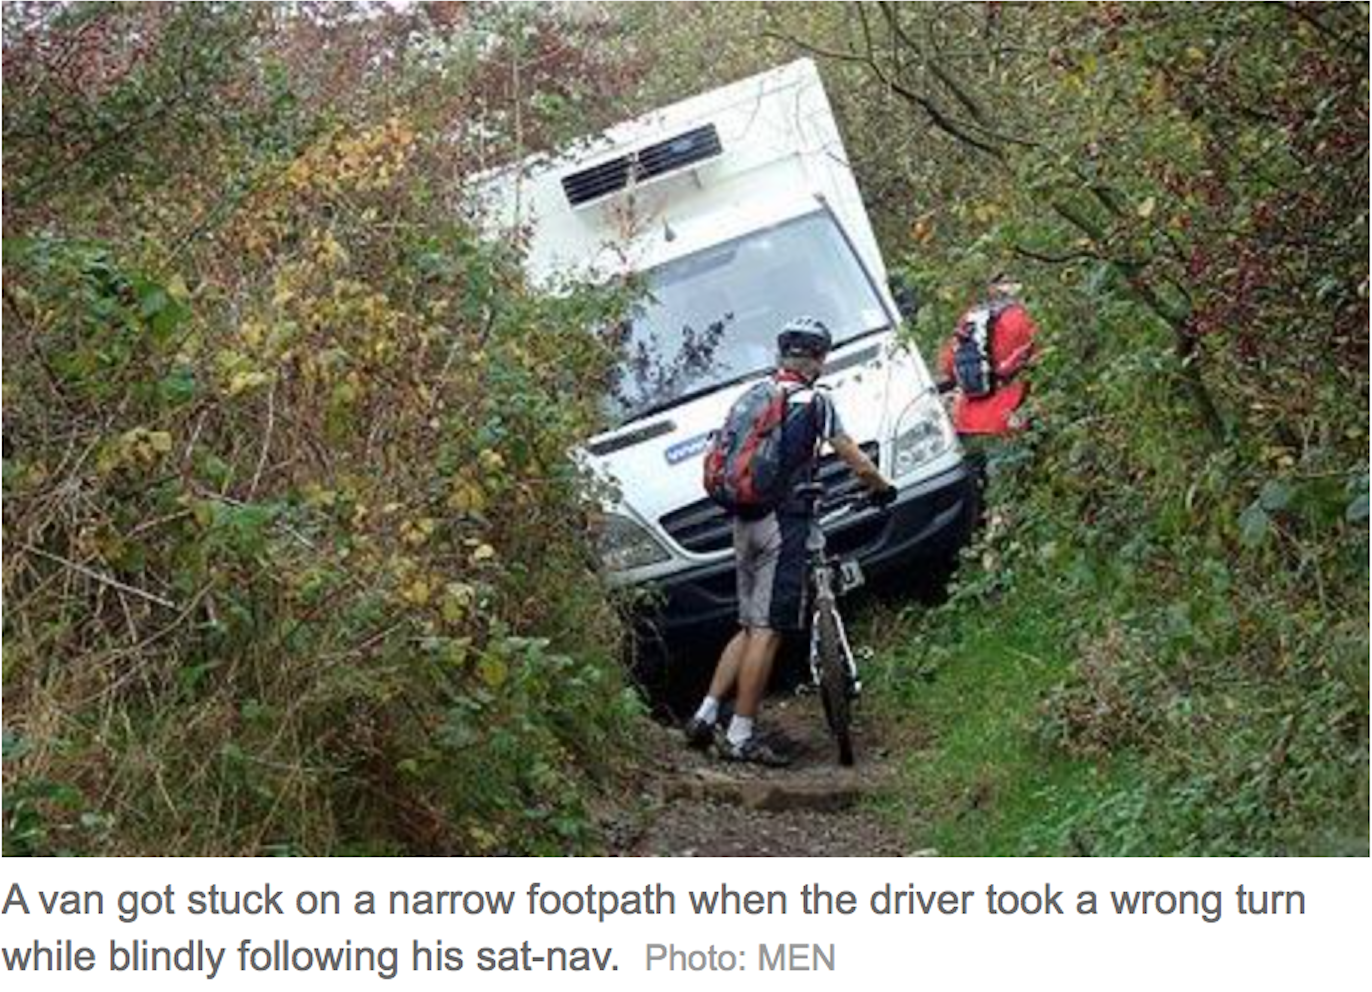
In the headline above, taken from the Telegraph newspaper, the driver trusted the SatNav to such an extent that he didn’t pay attention to the road-signs around him, and ended up getting stuck.
This wasn’t borne of stupidity, but experience: SatNavs are pretty reliable. So many times the SatNav had been right, that the driver stopped questioning its fallibility.
So, there are two Map and Territory Risks here:
- The Internal Model of the SatNav contained information that was wrong: the track had been marked up as a road, rather than a path.
- The Internal Model of the driver was wrong: his abstraction of “the SatNav is always right” turned out to be only mostly accurate.
We’ve already looked in detail at the Dependency Risks involved in relying on something like a SatNav, in the Software Dependency Risk section. But here, we are really looking at the Internal Models themselves as a source of Dependency Risk too.
You could argue that the SatNav and the Driver’s Internal Model had bugs in them. That is, they both suffer the Feature Implementation Risk we saw in the Feature Risk section. If a SatNav has too much of this, you’d end up not trusting it, and getting a new one. With your personal Internal Model, you can’t buy a new one, but you may learn to trust your assumptions less.
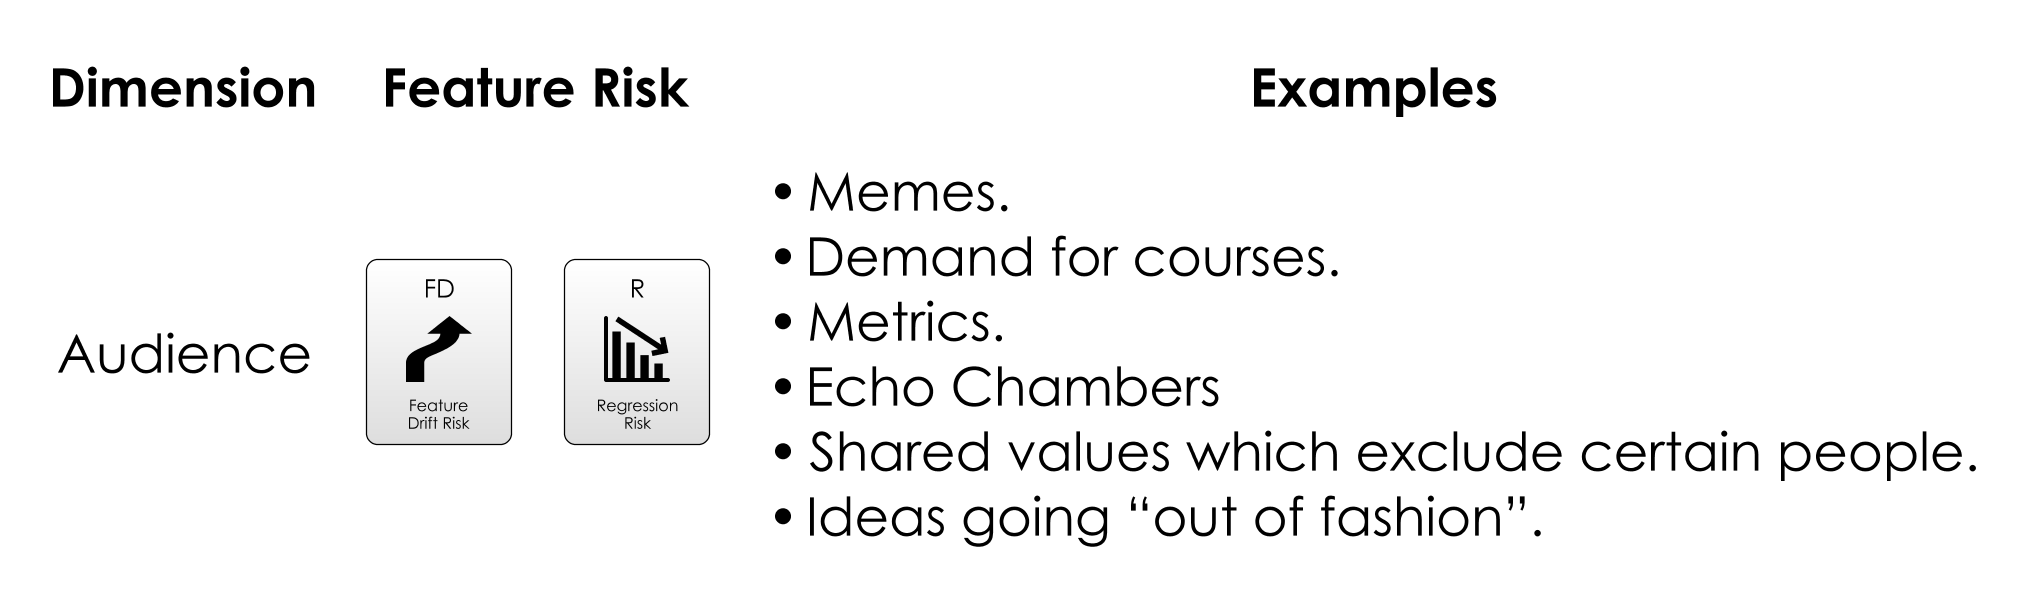
In the Feature Risk section, we broke down Feature Risk on three axes: Fitness, Evolution and Audience.
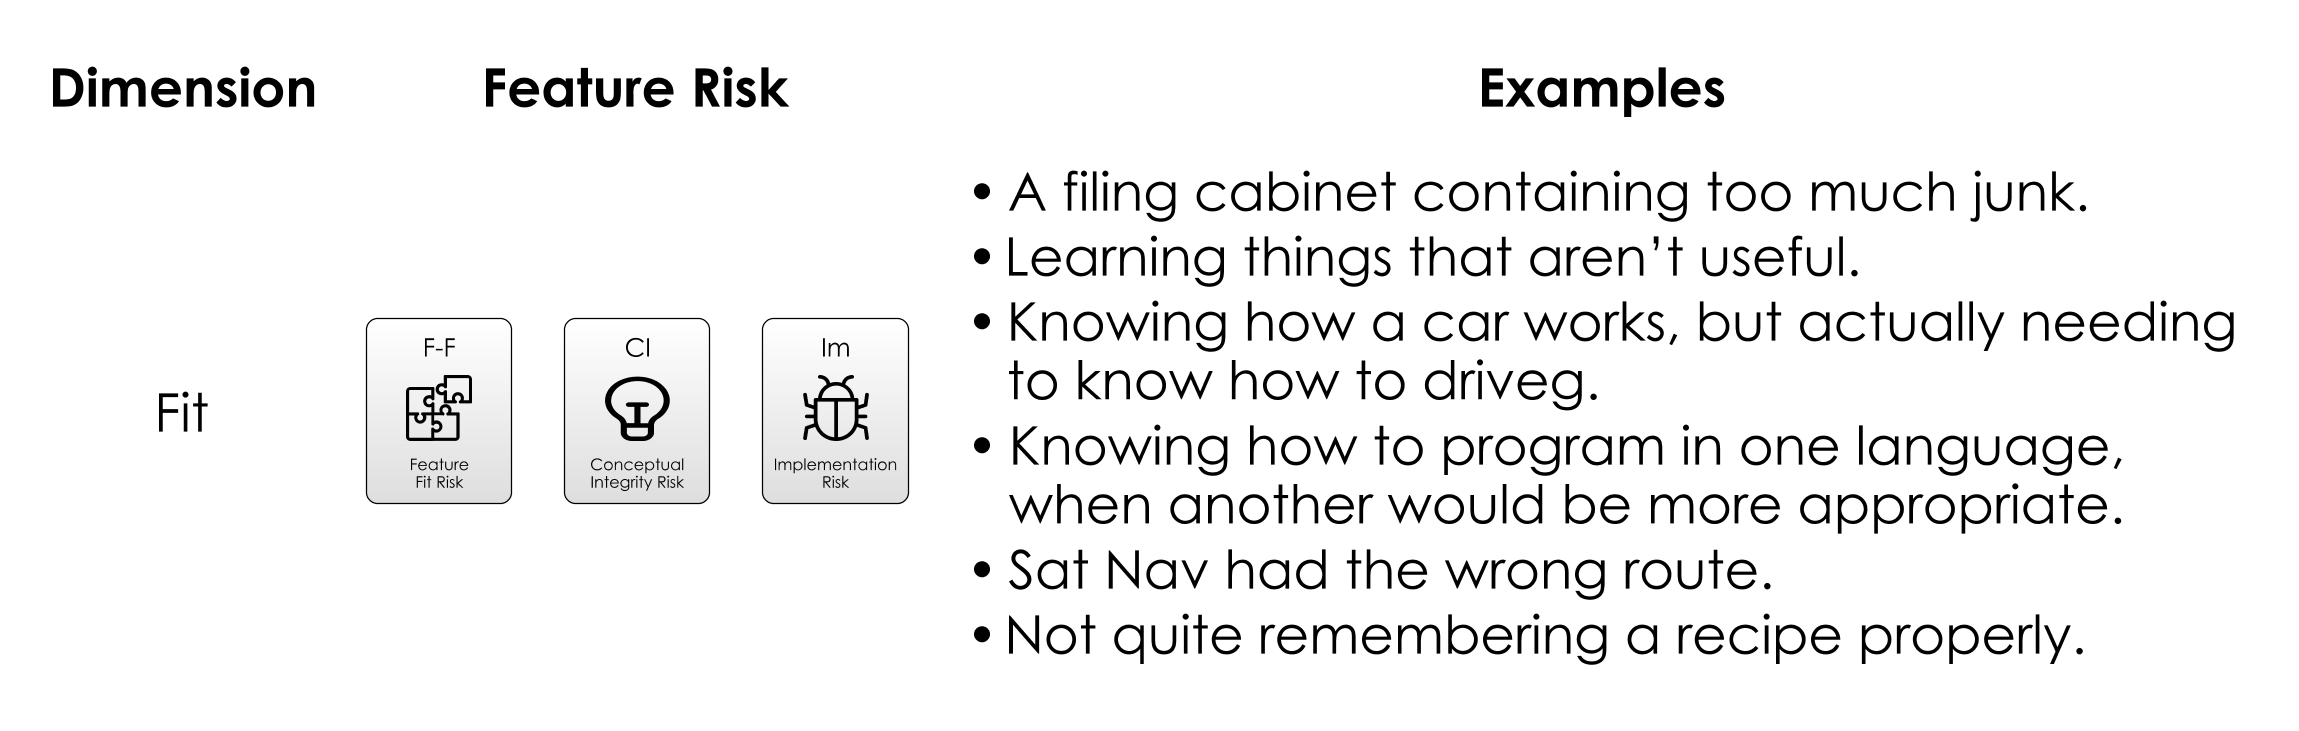
The diagram above does this again, showing how type of Feature Fit Risk can manifest in the Internal Model.
Audience
We already know a lot about Internal Models and Audience, as these have been the subject of previous sections:
- We know from looking at Communication Risk that communication allows us to share information between Internal Models.
- We know from Coordination Risk the difficulties inherent in aligning Internal Models so that they cooperate.
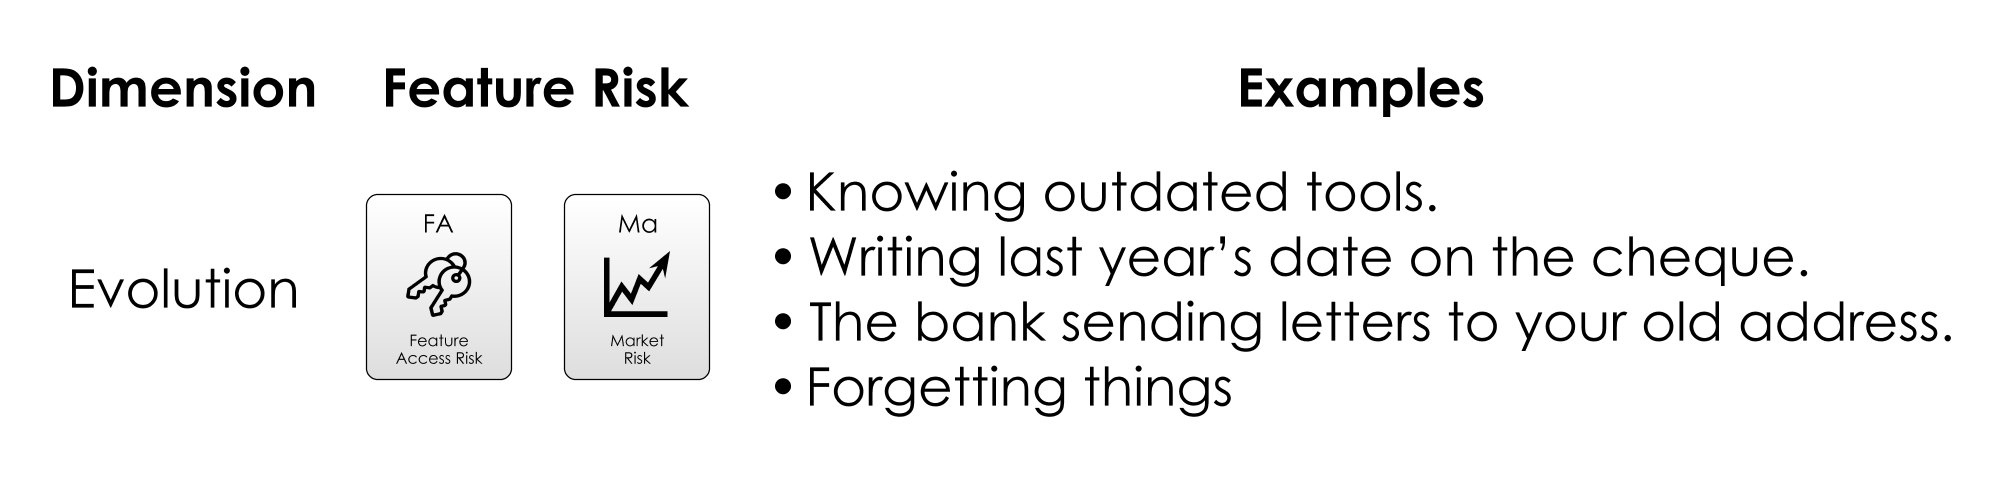
- Job markets show us that there is demand for people with certain skills. This demonstrates to us that Market Risk is as applicable to Internal Models containing certain information as it is to products containing Features. This was the focus of the Ecosystem discussion in Boundary Risk.
, 2011-2018](images/google-trends.png)
Therefore, we should be able to track the rise-and-fall of ideas much as we can track stock prices. And in effect, this is what Google Trends does. In the chart above, we can see the relative popularity of two search terms over time. This is probably as good an indicator as any of the audience for an abstraction at any point in time.
Example: Hype Cycles
Most ideas (and most products) have a slow, hard climb to wide-scale adoption. But some ideas seem to disperse much more rapidly and are picked up quickly because they are exciting and promising, having greater “memetic potential” within society. One way this evolution manifests itself in the world is though the Hype Cycle:
“The hype cycle is a branded graphical presentation developed and used by the American research, advisory and information technology firm Gartner, for representing the maturity, adoption and social application of specific technologies. The hype cycle provides a graphical and conceptual presentation of the maturity of emerging technologies through five phases.” - Hype Cycle, Wikipedia
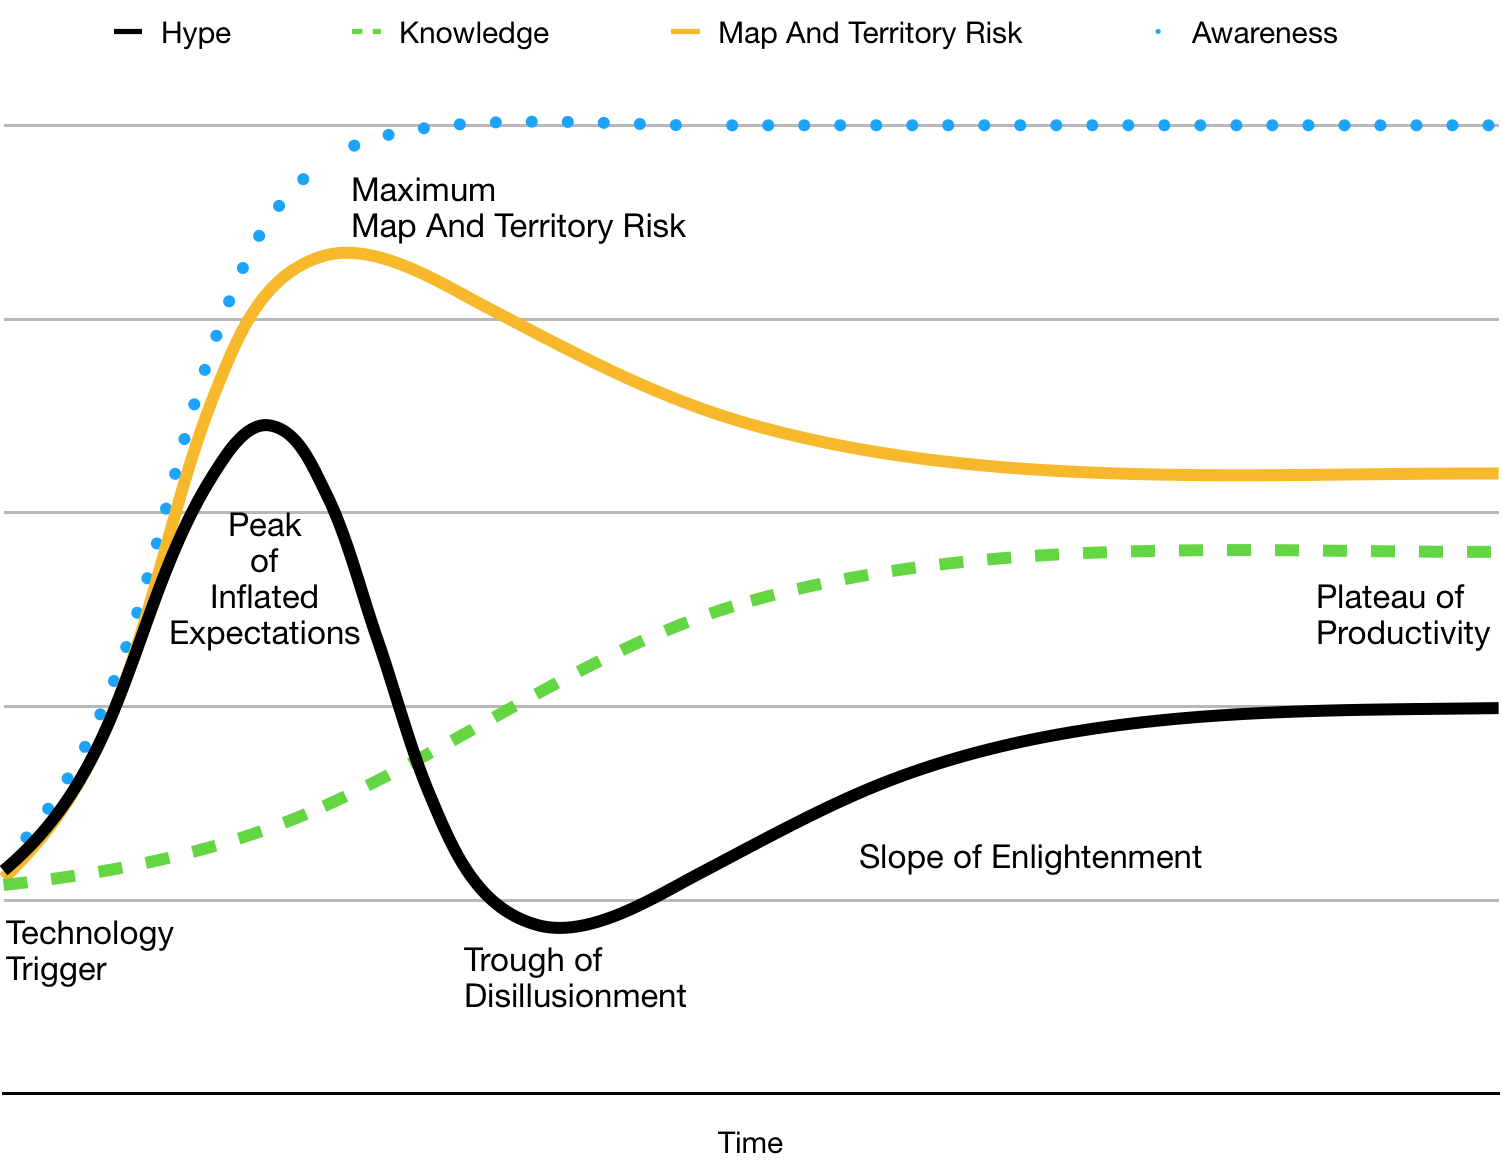
The five phases (and the “Hype” itself as the thick black line) are shown in the chart above. We start off at the “Technology Trigger”, moving to the “Peak of Inflated Expectations”, then to the “Trough of Disillusionment” and finally to the “Plateau of Productivity”.
The concept of Map and Territory Risk actually helps explain why this curve has the shape it does. The chart above also shows where the hype originates:
- The awareness of the idea within the audience as a dotted line.
- The knowledge of the idea by the audience (a Learning Curve, if you will) as a dashed line.
Both of these are modelled with Cumulative Distribution curves, which are often used for modelling the spread of a phenomena (disease, product uptake, idea) within a population. From these two things, we can figure out where our maximum Map and Territory Risk lies: it’s the point where awareness of an idea is farthest from the understanding of it.
This Map and Territory Risk acts as a “brake” on the hype around the idea. In the diagram, our “hype” curve is calculated as being the same as the “saturation” line, with a subtraction due to Map and Territory Risk. As you can see, “hype” drops fastest at the point where Map and Territory Risk is at its greatest, and we end up in the “Trough of Disillusionment”.
As you might expect, the “Trough of Disillusionment” exists because the “saturation” of the idea and the “amount known” about it increase at different rates.
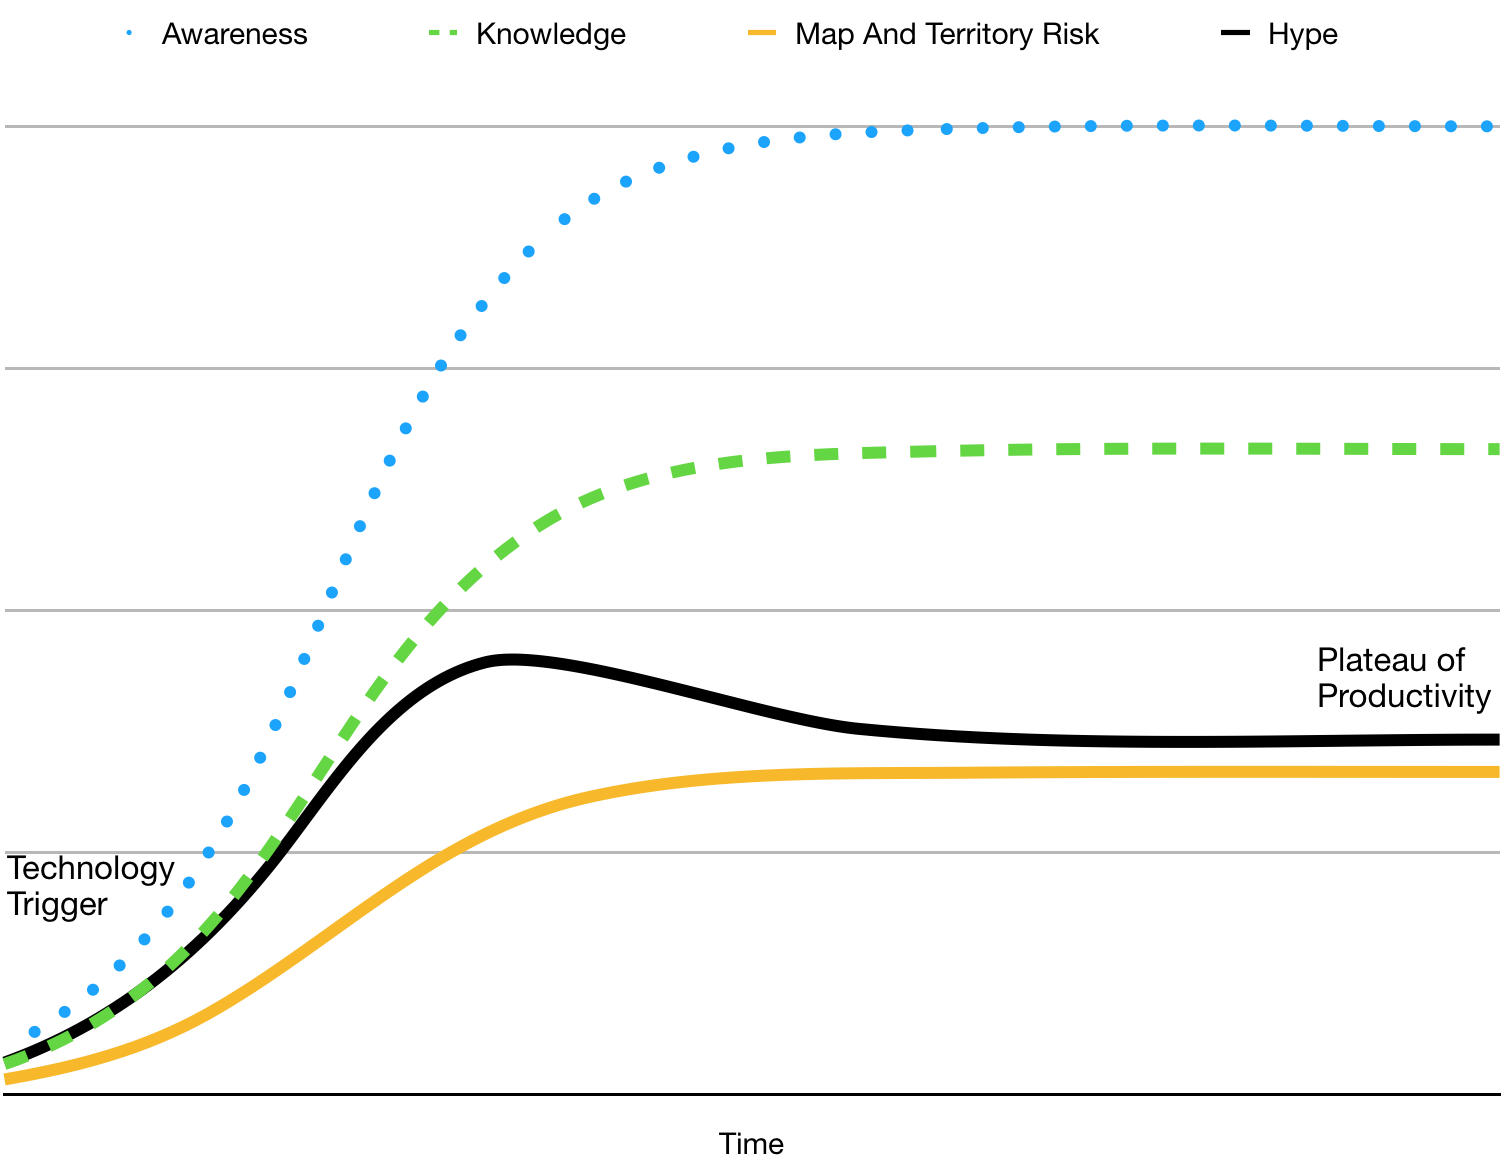
Where the saturation and knowledge grow more evenly together, there is no spike in Map and Territory Risk and we don’t see the corresponding “Trough of Disillusionment” at all, as shown in the above chart.
Evolution
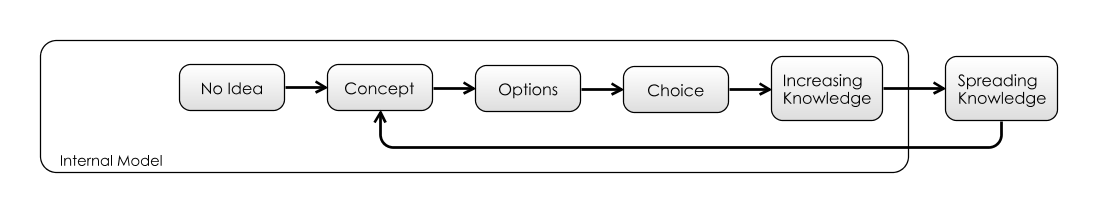
The section on Communication Risk introduced the above diagram for the spread of ideas. But what happens next? As we saw in Boundary Risk, the Peter Principle applies, people will use dependencies up to the point when they start breaking down.
Example: Metrics
Let’s dive into a specific example now: someone finds a useful new metric that helps in evaluating performance.
It might be:
- Source Lines Of Code (SLOC): i.e. the number of lines of code each developer writes per day/week whatever.
- Function Points: the number of function points a person on the team completes, each sprint.
- Code Coverage: the number of lines of code exercised by unit tests.
- Response Time: the time it takes to respond to an emergency call, say, or to go from a feature request to production.
- Release cadence: number of releases a team performs, per month, say.
With some skill, they may be able to correlate this metric against some other more abstract measure of success. For example:
- “quality is correlated with more releases”
- “user-satisfaction is correlated with SLOC”
- “revenue is correlated with response time”
Because the thing on the right is easier to measure than the thing on the left, it becomes used as a proxy (or, Map) for the thing they are really interested in (the Territory). At this point, it’s easy to communicate this idea with the rest of the team, and the market value of the idea is high: it is a useful representation of reality, which is shown to be accurate at a particular point in time.
But correlation doesn’t imply causation. The cause might be different:
- Quality and number of releases might both be down to the simplicity of the product.
- User satisfaction and SLOC might both be down to the calibre of the developers.
- Response time and revenue might both be down to clever team planning.
Metrics are seductive because they simplify reality and are easily communicated. But they inherently contain Map and Territory Risk: by relying only on the metrics, you’re not really seeing the reality.
The devil is in the detail.
Reality Evolves
In the same way that markets evolve to demand more features, our behaviour evolves to incorporate new ideas. The more popular an idea is, the more people will modify their behaviour as a result of it, and the more the world will change.
In the case of metrics, this is where they start being used for more than just indicators, but as measures of performance or targets:
- If a team is told to do lots of releases, they will perform lots of releases at the expense of something else.
- If team members are promoted according to SLOC, they will make sure their code takes up as many lines as possible.
- In the UK, ambulances were asked to wait before admitting patients to Emergency wards, in order that hospitals could meet their targets.
“Any observed statistical regularity will tend to collapse once pressure is placed upon it for control purposes.” - Goodhart’s Law, Wikipedia
Some of this seems obvious: Of course SLOC is a terrible measure performance! We’re not that stupid anymore. The problem is, it’s not so much the choice of metric, but the fact that all metrics merely approximate reality with a few numbers. The map is always simpler than the territory, therefore there can be no perfect metrics.
Will the idea still be useful as the world adapts? Although the Hype Cycle model doesn’t cover it, ideas and products all eventually have their day and decline in usefulness.
Bad Ideas
There are plenty of ideas which seem a really good idea at the time but then end up being terrible. It’s only as we improve our internal model and realize the hidden risks that we stop using them. While SLOC is a minor offender, CFCs or Leaded Petrol are more significant examples.
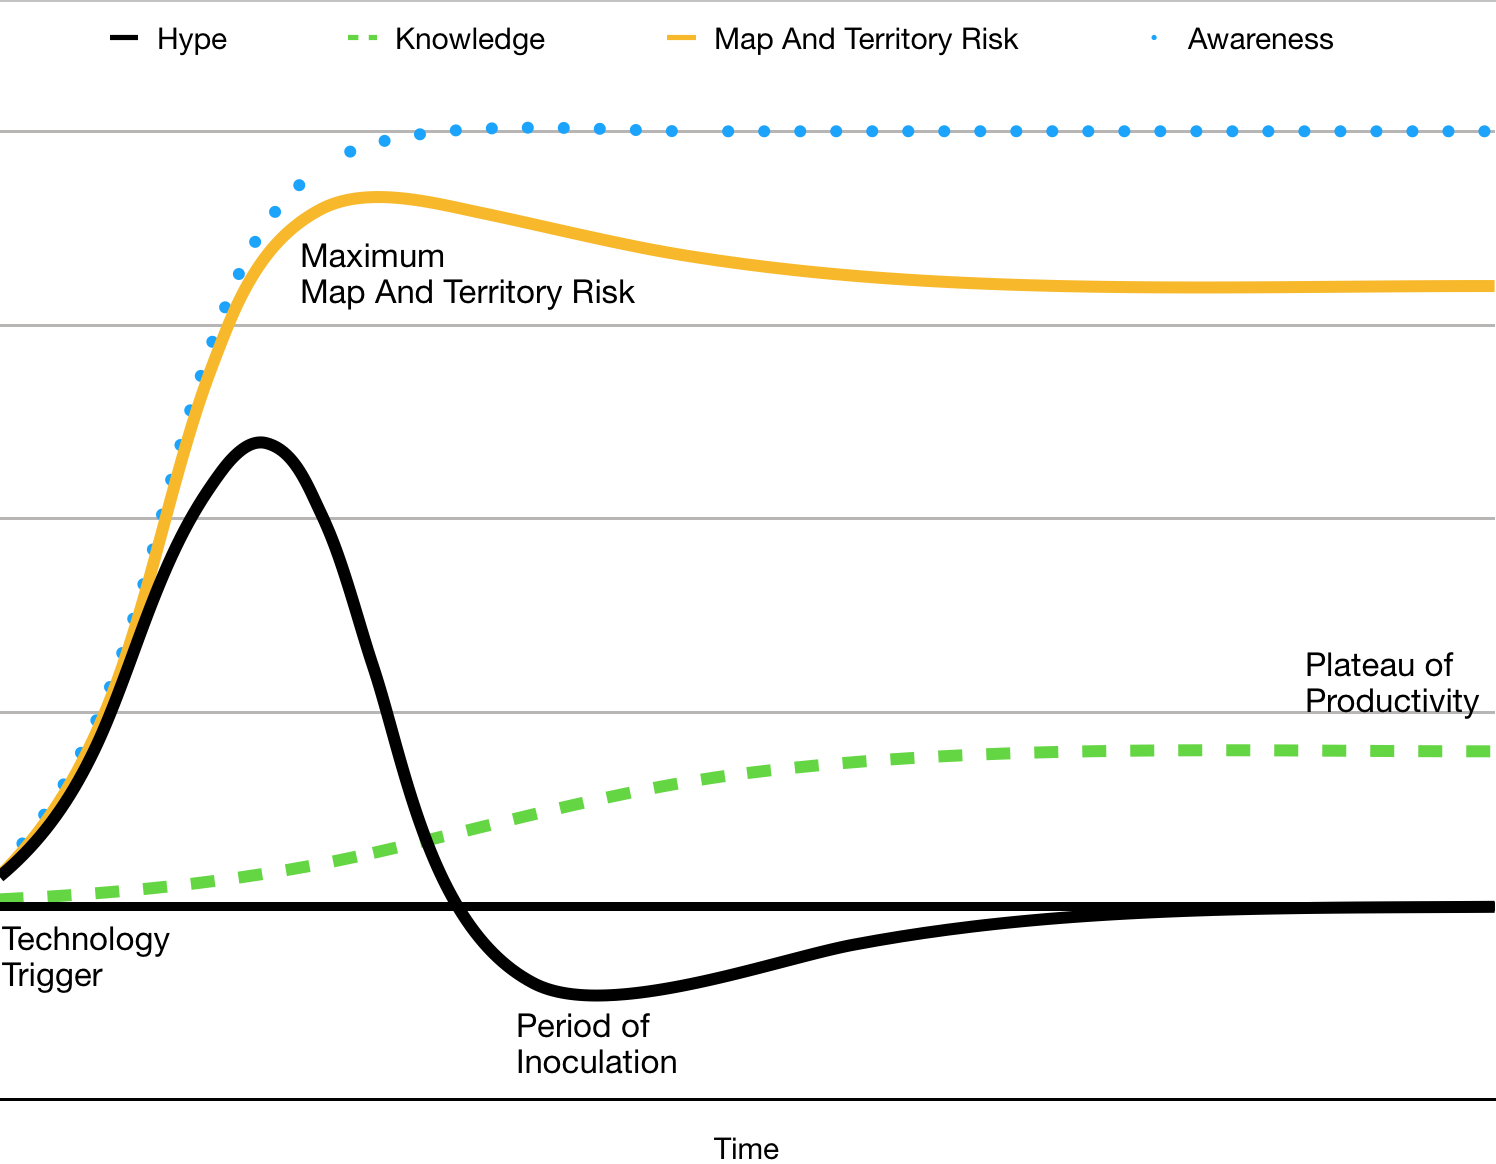
The above chart shows an initially promising idea that turns out to be terrible, and there is a “Period of Inoculation” where the population realise their mistake. There is “negative hype” as they work to phase out the offending idea.
SLOC is not on its own a bad idea, but using it as a metric for developer productivity is:
“Measuring programming progress by lines of code is like measuring aircraft building progress by weight.” - Bill Gates
Humans and Machines
In the example of the SatNav, we saw how the quality of Map and Territory Risk is different for people and machines. Whereas people should be expected show skepticism to new (unlikely) information, our databases accept it unquestioningly. Forgetting is an everyday, usually benign part of our human Internal Model, but for software systems it is a production crisis involving 3am calls and backups.
For Humans, Map and Territory Risk is exacerbated by cognitive biases:
“Cognitive biases are systematic patterns of deviation from norm or rationality in judgement, and are often studied in psychology and behavioural economics.” - Cognitive Bias, Wikipedia
There are lots of cognitive biases. But let’s just look at a couple that are relevant to Map and Territory Risk:
- Availability Heuristic: people overestimate the importance of knowledge they have been exposed to.
- The Ostrich Effect: which is where dangerous information is ignored or avoided because of the emotions it will evoke.
- Bandwagon Effect: people like to believe things that other people believe. (Could this be a factor in the existence of the Hype Cycle?)
Hierarchical Organisations
Map And Territory Risk “trickles down” through an organisation. The higher levels have an out-sized ability to pervert the incentives at lower levels because once an organisation begins to pursue a “bullshit objective”, the whole company can align to this.
The Huffington Post paints a brilliant picture of how Volkswagen managed to get caught faking their emissions tests. As they point out:
“The leadership culture of VW probably amplified the problem by disconnecting itself from the values and trajectory of society, by entrenching in what another executive in the auto industry once called a “bullshit-castle”… No engineer wakes up in the morning and thinks: OK, today I want to build devices that deceive our customers and destroy our planet. Yet it happened. Why? Because of hubris at the top. “ - Otto Scharmer, Huffington Post.
This article identifies the following process:
- De-sensing: VW Executives ignored The Territory society around them (such as the green movement), ensuring their maps were out of date. The top-down culture made it hard for reality to propagate back up the hierarchy.
- Hubris/Absencing: they pursued their own metrics of volume and cost, rather than seeking out others (a la the Availability Heuristic Bias). That is, focusing on their own Map, which is easier than checking the Territory.
- Deception: backed into a corner, engineers had no choice but to find “creative” ways to meet the metrics.
- Destruction: eventually, the truth comes out, to the detriment of the company, the environment and the shareholders. As the article’s title summarizes “A fish rots from the head down”.
Markets
So far, we’ve considered Map and Territory Risk for individuals, teams and organisations. Inadequate Equilibria by Eleizer Yudkovsky, looks at how perverse incentive mechanisms break not just departments, but entire societal systems. He highlights one example involving academics and grantmakers in academia:
- It’s not very apparent which academics are more worthy of funding.
- One proxy is what they’ve published (scientific papers) and where they’ve published (journals).
- Universities want to attract research grants, and the best way to do this is to have the best academics.
- Because “best” isn’t measurable, they use the publications proxy.
- Therefore, immense power rests in the hands of the journals, since they can control this metric.
- Therefore, journals are able to charge large amounts of money to universities for subscriptions.
“Now consider the system of scientific journals… Some journals are prestigious. So university hiring committees pay the most attention to publications in that journal. So people with the best, most interesting-looking publications try to send them to that journal. So if a university hiring committee paid an equal amount of attention to publications in lower-prestige journals, they’d end up granting tenure to less prestigious people. Thus, the whole system is a stable equilibrium that nobody can unilaterally defy except at cost to themselves.” - Inadequate Equilibria, Eleizer Yudkovsky
As the book points out, while everyone persists in using an inadequate abstraction, the system is broken. However, Coordination would be required for everyone to stop doing it this way, which is hard work. (At least within a top-down hierarchy, Maps can get fixed.)
This is a small example from a larger, closely argued book investigating lots of examples of this kind. It’s worth taking the time to read a couple of the chapters on this interesting topic. (Like Risk-First, it is available to read online).
As usual, this section forms a grab-bag of examples in a complex topic. But it’s time to move on as there is one last stop we have to make on the Risk Landscape, and that is to look at Operational Risk.
The Hype Cycle model is available in Numbers format here.
Now, on to the last risk in our tour, Operational Risk.