Risk-First Analysis Framework
Start Here
Home
Contributing
Quick Summary
A Simple Scenario
The Risk Landscape
Discuss
Please star this project in GitHub to be invited to join the Risk First Organisation.
Publications

Click Here For Details
Staging and Classifying
Our tour is complete.
On this journey around the Risk Landscape we’ve collected a (hopefully) good, representative sample of Risks and where to find them. But if we are good collectors, then before we’re done we should Stage our specimens and do some work in classifying what we’ve seen.

If you’ve been reading closely, you’ll notice that a number of themes come up again and again within the different sections. Concepts like Abstraction, Evolution and Fit. Although we’ve been looking at patterns of risk across software projects, it’s time to look at the patterns within the patterns.
The Power Of Abstractions
Abstraction appears as a concept continually: in Communication Risk, Complexity Metrics, Map and Territory Risk or how it causes Boundary Risk. We’ve looked at some complicated examples of abstractions, such as network protocols, dependencies on technology or Business Processes.
Let’s now generalize what is happening with abstraction. To do this, we’ll consider the simplest example of abstraction: naming a pattern of behaviour we see in the real world, such as “Binge Watching” or “Remote Working”, or naming a category of insects as “Beetles”.
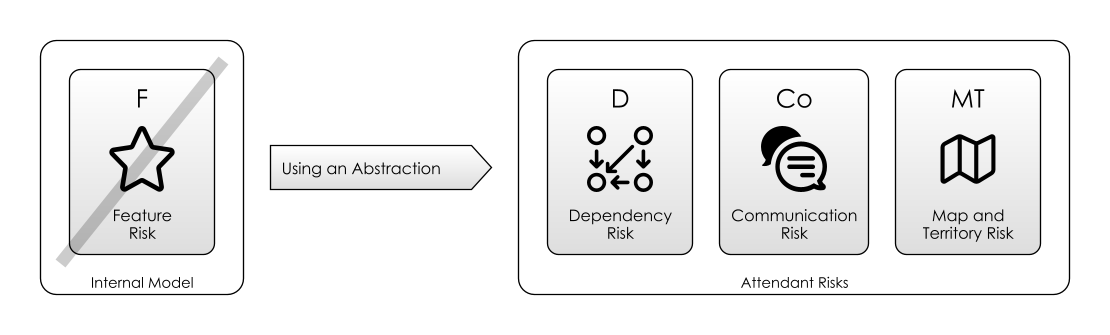
Using An Existing Abstraction means:
- Mitigating Feature Risk: because the abstraction is providing you with something useful. For example, using the word “London” allows you to refer to a whole existing (but slightly non-specific) geographic area.
- Accepting Communication Risk : because if you are using the abstraction in conversation, the people you are using it with need to understand it too.
- Accepting Map and Territory Risk: because the abstraction is a simplification, and not the actual thing itself.
- Living with Dependency Risk: we depend on a word in our language (or a function in our library, or a service on the Internet). But words are unreliable. They might not communicate what you want them to, or be understood by the audience. Language changes and evolves, and the words you are using now might not always mean what you want them to mean. (Software too changes and evolves: We’ve seen this in Red Queen Risk and Feature Drift Risk.)
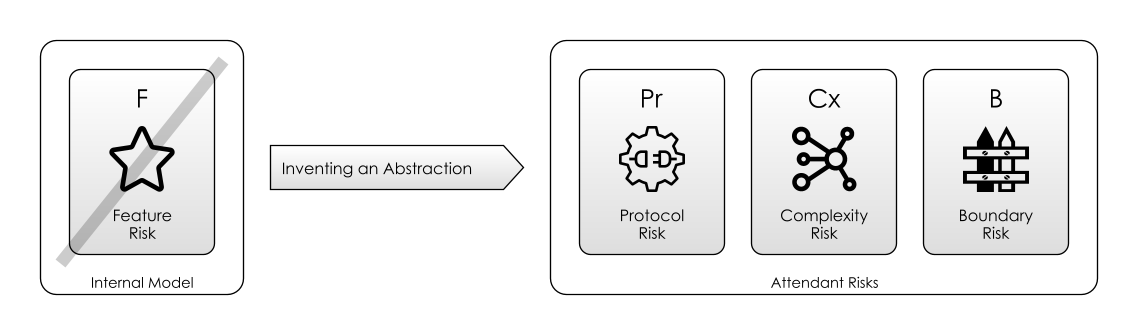
Inventing A New Abstraction means:
- Mitigating Feature Risk. By giving a name to something (perhaps a new product, or a way of working) you are offering up something that someone else can use in conversation. This should mitigate Features in the sense that other people can choose to use your name, if it fits their requirements.
- Creating a Protocol. At the very simplest level (again), this is just introducing new words to a language. Therefore, we create Protocol Risk: what if the person we are communicating with doesn’t know this word?
- Increasing Complexity Risk. Because, the more words we have, the more complex the language is.
- Creating Boundary Risk. By naming something, you implicitly create a boundary, because the world is now divided into “things which are X” and “things which are not X”. Sometimes, this abstraction may literally end up having a physical boundary to enforce this division (such as the fence separating “My Property” from “Not My Property”). Boundary Risk is a result of abstractions.
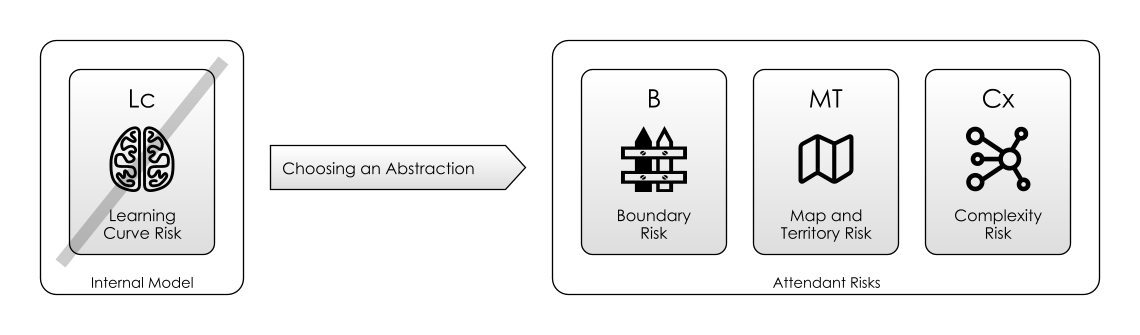
Choosing Between Abstractions means:
- Overcoming a Learning Curve: because you have to learn a name in order to use it (whether a function, a dog, or the name of someone at a party).
- Accepting Boundary Risks. Just using a single word means accepting the whole ecosystem of the language the word is in. Using French words means the Boundary Risk of the French Language.
- Accepting Map And Territory Risk. Because the word refers to the concept of the thing, and not the thing itself.
Abstraction (like any other action) is everywhere and seems to be at the heart of what our brains do. But clearly, there is a trade-off with abstraction: as you can see above, there are risks on both sides of the action.
Naming something seems innocuous, a small thing. Consider all the classes, variables, products and systems in software development that have names. Do all of these names “factor” correctly to things in the real world? Or do they introduce arbitrary classification? (For example, you might classify water as “hot” or “cold” while really there is just temperature.)
Abstraction is a small thing, but its effects compound massively.
Your Feature Risk is Someone Else’s Dependency Risk
In the Feature Risk section, we looked at the problems of supplying something for a client to use as a dependency: you’ve got to satisfy a demand (Market Risk), and service a segment of the user community (Feature Access Risk).
However, over the rest of the Dependency Risk sections, we looked at this from the point of view of being a client to someone else: you want to find trustworthy, reliable dependencies that don’t give up when you least want them to.
So Feature Risk and Dependency Risk are two sides of the same coin. You face Dependency Risk when you’re a client, Feature Risk when you’re the supplier.
To use a dependency requires the client and the supplier to communicate, and this entails Communication Risk. You have to learn to use a dependency. Maybe its supplier learns something from you. This changes internal models.
These relationships of features/dependencies are the basis of Supply Chains and the world-wide network of goods and services that forms the modern economy. The incredible complexity of this network mean incredible Complexity Risk, too. Humans are masters at coordinating and managing our dependencies.
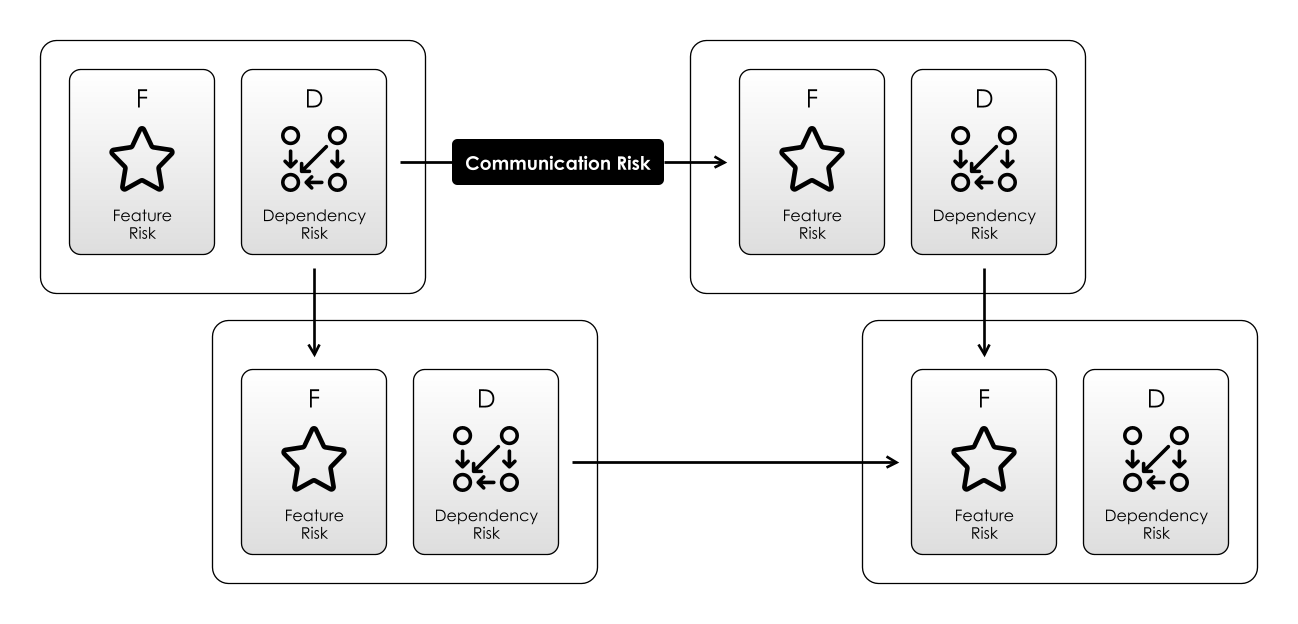
Original Risk
As we discussed in Dependency Risk, depending on things is necessary for life, whether it is oxygen, food or sunlight. Our problems compound when we try to Coordinate with the dependencies themselves or each other.
- Coordination is the root of Communication Risk, as without coordination, we don’t have to care about what the world is trying to tell us, or what we are trying to tell the world.
- Communication Risk then begets Map and Territory Risk, because
- Communication Risk also means Complexity Risk, because now we have built a communication graph (and we saw how to calculate how complex that is).
- Boundary Risk, this is at a confluence of Dependency Risk, Communication Risk and Complexity Risk.
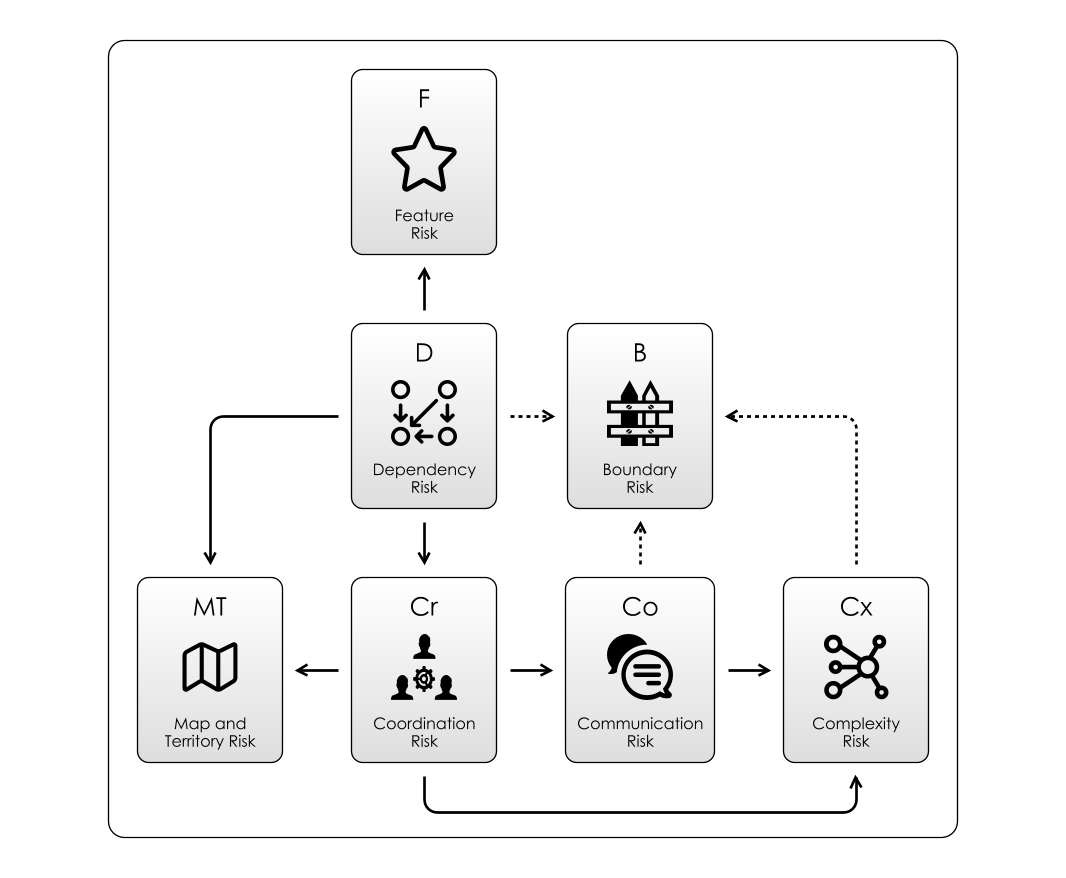
The way this plays out is depicted in the diagram above.
Towards A “Periodic Table” Of Risks
As we said at the start, Risk-First is all about developing A Pattern Language. We can use the terms like “Feature Risk“_ or “Learning Curve Risk” to explain phenomena we see on software projects. If we want to De-Risk our work, we need to be able to explain what the risks are, and what we expect to do about them.
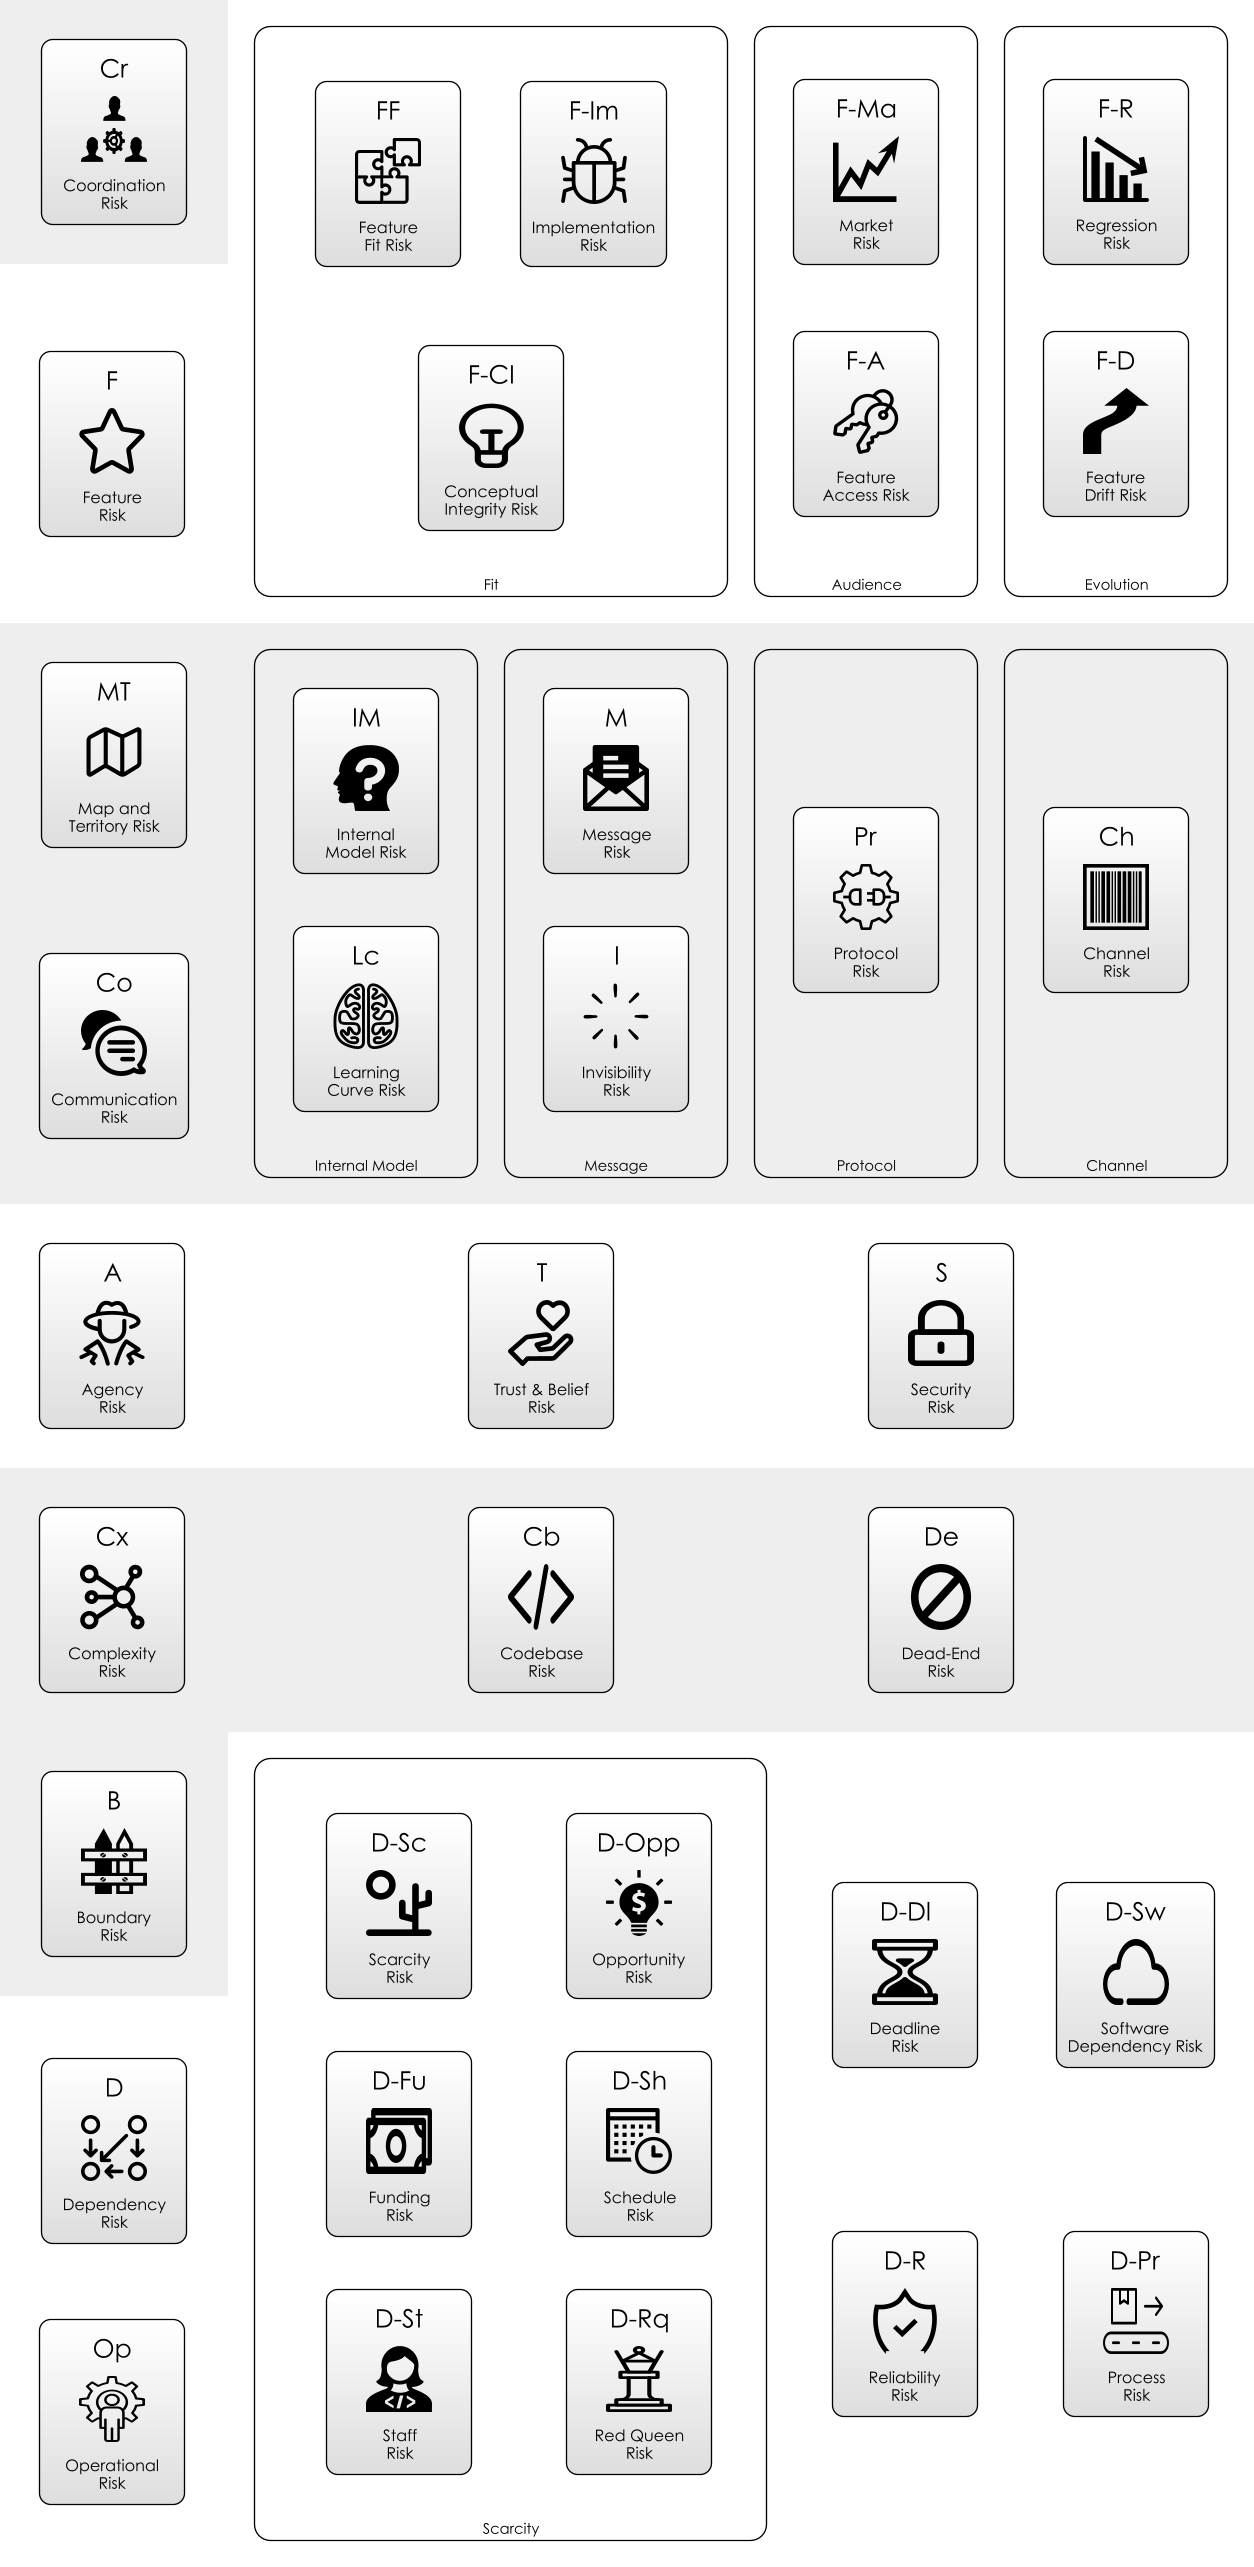
The diagram above compiles all of the risks we’ve seen so far on the journey across the risk landscape. Just like a periodic table, there are perhaps others left to discover. Unlike a periodic table, these risks are not completely distinct: they mix like paint and blend into one another.
Please help by reporting back what you find.